TODAY'S OUTLOOK ON GOLD (XAUUSD) H-4; MARCH 31, 2026 |
GOLD (XAUUSD) ANALYSIS MARCH 30-APRIL 03, 2026
DESCRIPTION
This video provides a top-down technical analysis of XAUUSD (Gold) for the final two days of March and the first three days of April (March 30 - April 03). The analysis utilizes candlestick patterns, support and resistance levels, and Elliott Wave theory to forecast market direction.
ANALYSIS.
Monthly View: The March candle shows strong bearish momentum, indicating sellers are active at the current region.
Weekly View: The current weekly candle shows indecision but buyers pushed the price back up, suggesting a battle between buyers and sellers at the current market price.
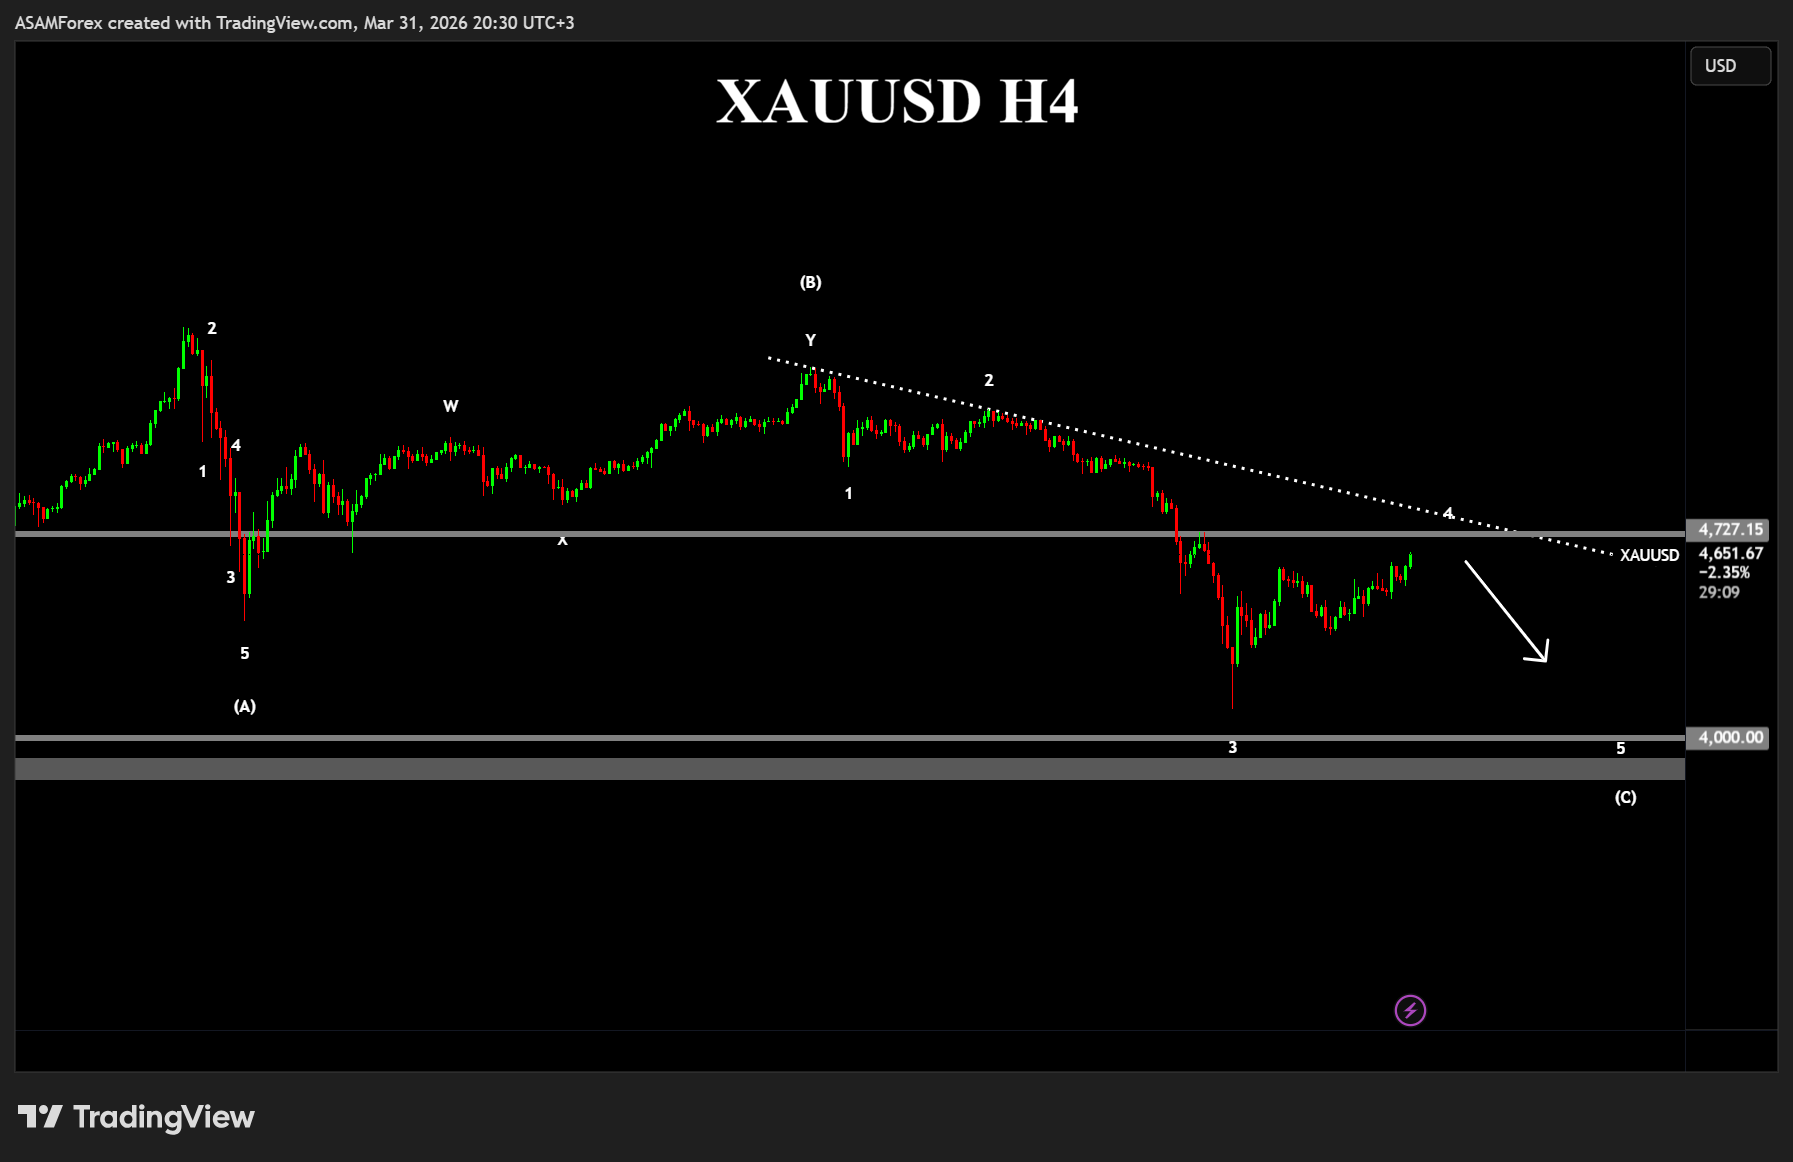
Daily View: Gold is currently in the formation of Wave C to the downside, which is expected to have five internal waves. Price is approaching a strong support level.
4-Hour View: A minor support level around the 4,000 psychological level is identified as crucial for trading decisions.
PRIMARY PROJECTION.
Short-term: Watch for potential short-term sell opportunities during the formation of waves three and five to the downside.
ALTERNATIVE PROJECTION.
Long-term: Look for buy signals around the 4,000 level for a potential stronger long-term bullish move after the completion of the current wave sequence.